| Miles de empresas | ||||||||||
| Año | Persona Morales | Subtotal | Persona Físicas | Subtotal | Total | |||||
| Pasaje | Turismo | Carga General | Carga Especializada | Pasaje | Turismo | Carga | ||||
| 2004 | 1,337 | 2,120 | 8,202 | 2,776 | 14,435 | 1,695 | 7,157 | 94,336 | 103,188 | 117,623 |
| 2005 | 1,375 | 2,311 | 8,815 | 2,943 | 15,444 | 1,663 | 7,534 | 96,624 | 105,821 | 121,265 |
| 2006 | 1,617 | 2,577 | 10,632 | 3,366 | 18,192 | 1,665 | 8,061 | 102,602 | 112,328 | 130,520 |
| 2007 | 1,652 | 2,888 | 11,373 | 3,550 | 19,463 | 1,673 | 8,467 | 106,563 | 116,703 | 136,166 |
| 2008 | 1,075 | 2,338 | 10,287 | 2,894 | 16,594 | 1,472 | 7,114 | 94,360 | 102,946 | 119,540 |
| 2009 | 1,207 | 2,649 | 12,098 | 3,412 | 19,366 | 1,578 | 7,702 | 109,535 | 118,815 | 138,181 |
| 2010 | 1,213 | 2,942 | 13,210 | 3,682 | 21,047 | 1,597 | 7,852 | 113,964 | 123,413 | 144,460 |
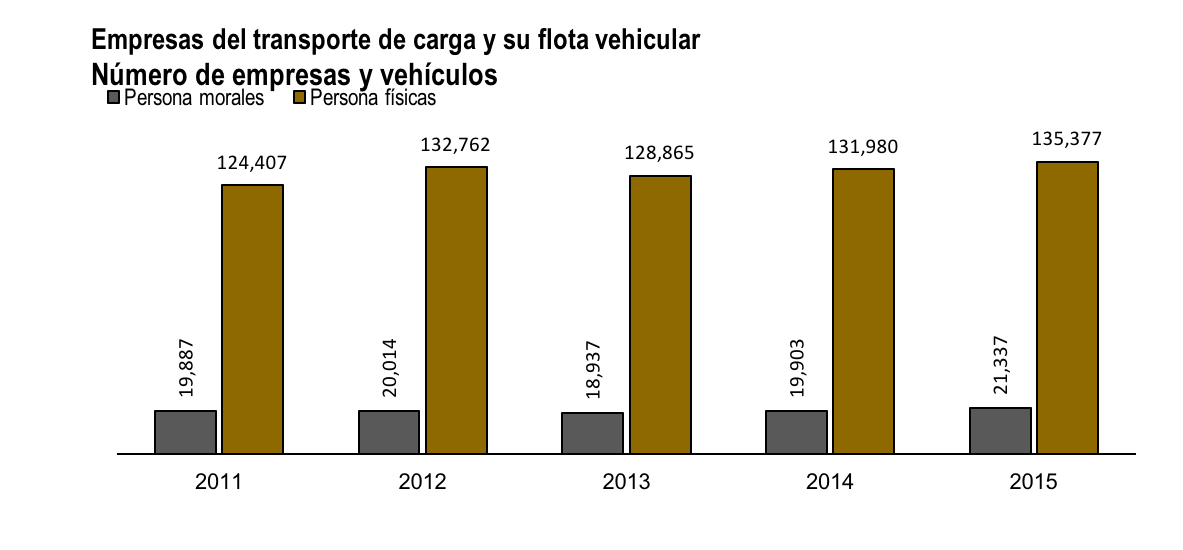
| 2011 | 1,243 | 3,895 | 15,370 | 4,517 | 25,025 | 1,613 | 9,473 | 124,407 | 135,493 | 160,518 |
| 2012 | 1,556 | 3,972 | 15,298 | 4,716 | 25,542 | 1,855 | 10,152 | 132,762 | 144,769 | 170,311 |
| 2013 | 1,438 | 3,820 | 14,416 | 4,521 | 24,195 | 1,704 | 10,000 | 128,865 | 140,569 | 164,764 |
| 2014 | 1,409 | 4,020 | 15,084 | 4,819 | 25,332 | 1,637 | 10,284 | 131,980 | 143,901 | 169,233 |
| 2015 | 1,443 | 29,810 | 16,109 | 5,228 | 52,590 | 1,596 | 20,474 | 135,377 | 157,447 | 210,037 |
Fuente: Estadística Básica del Autotransporte Federal 2015, SCT.