| Millones de dólares | ||||||||||
| Subsector | 2008 | 2009 | 2010 | 2011 | 2012 | 2013 | 2014 | 2015 | Variación 2015/2014 | |
| Absoluta | Part. % | |||||||||
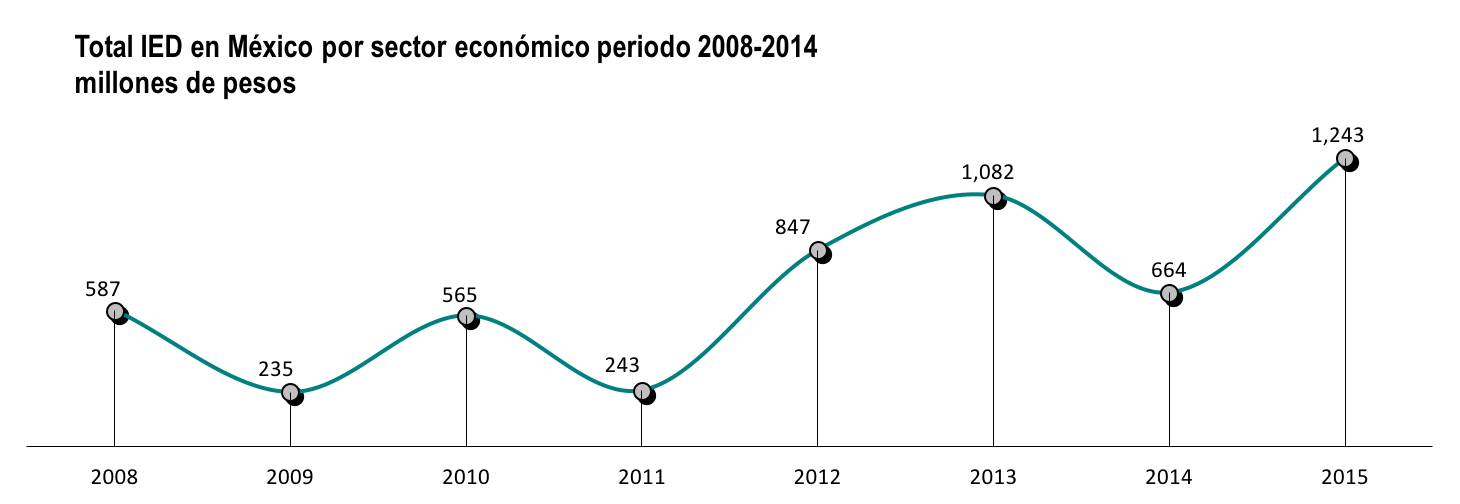
| Transporte, correos y almacenamiento | 587 | 235 | 565 | 243 | 847 | 1,082 | 664 | 1,243 | 579 | 100.0% |
| Transporte aéreo | 214 | 79 | 3 | -3 | 14 | 10 | 139 | 3 | -137 | 0.2% |
| Transportes por ferrocarril | 44 | -82 | 190 | -145 | -103 | 259 | 159 | 34 | -125 | 2.7% |
| Transportes por agua | 0 | 0 | -4 | 0 | -13 | 2 | -1 | 12 | 13 | 1.0% |
| Autotransporte de carga | 4 | 9 | 2 | -4 | -1 | 1 | 4 | -5 | -9 | -0.4% |
| Transporte terrestre de pasajeros | 0 | 0 | 0 | 97 | 72 | 653 | -27 | 15 | 42 | 1.2% |
| Transporte por ductos | 169 | 100 | 327 | -1 | 385 | 0 | 228 | 1,180 | 952 | 94.9% |
| Transporte turístico | 0 | 0 | 0 | 0 | 0 | 103 | 0 | 0 | 0 | 0.0% |
| Servicios relacionados con el transporte | 119 | 109 | 39 | 228 | 328 | 49 | 87 | 3 | -84 | 0.2% |
| Servicios de mensajería y paquetría | 0 | -5 | -4 | 34 | 153 | 2 | 66 | 3 | -63 | 0.2% |
| Servicios de almacenamiento | 37 | 26 | 13 | 36 | 13 | 2 | 11 | 0 | -10 | 0.0% |
Fuente: Informe Estadístico sobre el comportamiento de la Inversión Extranjera en México ene-dic 2015, SE.

