| Índice nacional de precios al consumidor | |||||
| Base segunda quincena de diciembre 2010=100 | |||||
| Periodo | Índice General | Variaciones % | |||
| Mensual | Anual | Acumulado | |||
| 2004 | Dic | 77.6137 | 0.21% | 5.19% | 5.19% |
| 2005 | Dic | 80.2004 | 0.61% | 3.33% | 3.33% |
| 2006 | Dic | 83.4511 | 0.58% | 4.05% | 4.05% |
| 2007 | Dic | 86.5881 | 0.41% | 3.76% | 3.76% |
| 2008 | Dic | 92.2407 | 0.69% | 6.53% | 6.53% |
| 2009 | Dic | 95.5370 | 0.41% | 3.57% | 3.57% |
| 2010 | Dic | 99.7421 | 0.50% | 4.40% | 4.40% |
| 2011 | Dic | 103.5510 | 0.82% | 3.82% | 3.82% |
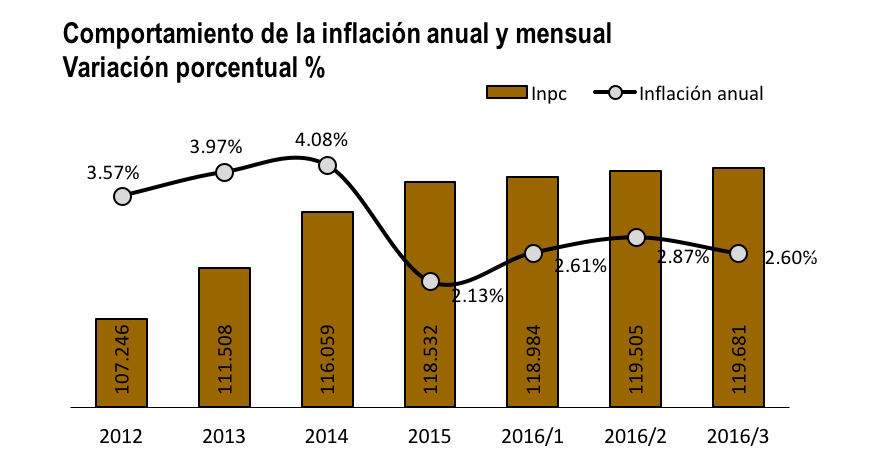
| 2012 | Dic | 107.2460 | 0.23% | 3.57% | 3.57% |
| 2013 | Dic | 111.5080 | 0.57% | 3.97% | 3.97% |
| 2014 | Dic | 116.0590 | 0.49% | 4.08% | 4.08% |
| 2015 | Dic | 118.5320 | 0.41% | 2.13% | 2.13% |
| 2016 | Ene | 118.9840 | 0.38% | 2.61% | 0.38% |
| Feb | 119.5050 | 0.44% | 2.87% | 0.82% | |
| Mar | 119.6810 | 0.15% | 2.60% | 0.97% | |
| Fuente: Inegi. | |||||

