| Mercancías transportadas vía terrestre |
| Millones de dólares |
| Tipo transporte |
2007 |
2008 |
2009 |
2010 |
2011 |
2012 |
2013 |
2014 |
2015 |
Importaciones país de origen EUU
|
| Autotransporte |
93,047 |
100,264 |
89,417 |
111,110 |
127,720 |
140,846 |
150,565 |
161,049 |
163,436 |
| Ferrocarril |
19,340 |
21,965 |
15,291 |
19,632 |
24,862 |
27,611 |
27,760 |
29,578 |
28,659 |
| Total |
112,387 |
122,229 |
104,708 |
130,742 |
152,582 |
168,457 |
178,325 |
190,627 |
192,095 |
Exportaciones país de destino EEUU
|
| Autotransporte |
137,037 |
134,224 |
117,787 |
148,948 |
167,483 |
182,403 |
184,946 |
199,619 |
213,116 |
| Ferrocarril |
27,060 |
25,265 |
19,303 |
28,484 |
32,303 |
36,912 |
42,063 |
44,111 |
46,455 |
| Total |
164,097 |
159,489 |
137,090 |
177,432 |
199,786 |
219,315 |
227,009 |
243,730 |
259,570 |
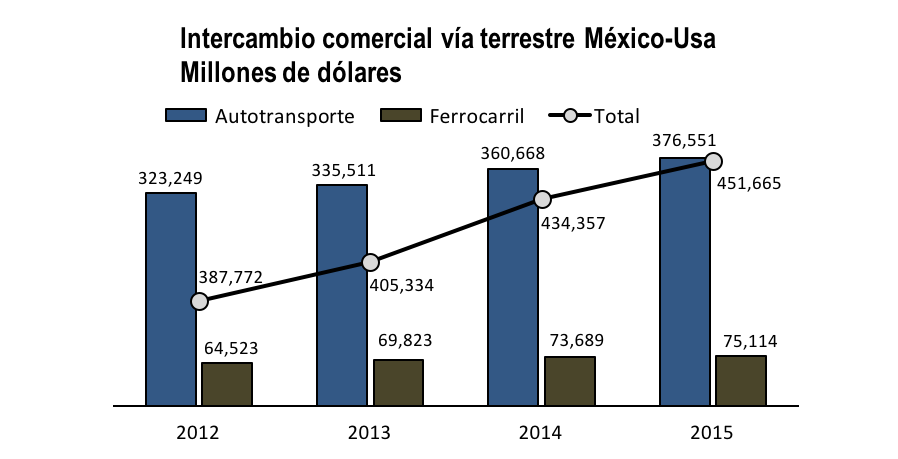
Flujo comercial México-Estados Unidos
|
| Autotransporte |
230,084 |
234,488 |
207,204 |
260,058 |
295,203 |
323,249 |
335,511 |
360,668 |
376,551 |
| Ferrocarril |
46,400 |
47,230 |
34,594 |
48,116 |
57,165 |
64,523 |
69,823 |
73,689 |
75,114 |
| Total |
276,484 |
281,718 |
241,798 |
308,174 |
352,368 |
387,772 |
405,334 |
434,357 |
451,665 |
Incremento porcentual, respecto al año anterior
|
| Autotransporte |
4.8% |
1.9% |
-11.6% |
25.5% |
13.5% |
9.5% |
3.8% |
7.5% |
3.4% |
| Ferrocarril |
7.6% |
1.8% |
-26.8% |
39.1% |
18.8% |
12.9% |
8.2% |
5.5% |
6.9% |
| Total |
5.3% |
1.9% |
-14.2% |
27.5% |
14.3% |
10.0% |
4.5% |
7.2% |
4.0% |
Participación porcentual del total
|
| Autotransporte |
83.2% |
83.2% |
85.7% |
84.4% |
83.8% |
83.4% |
82.8% |
83.0% |
83.0% |
| Ferrocarril |
16.8% |
16.8% |
14.3% |
15.6% |
16.2% |
16.6% |
17.2% |
17.0% |
17.0% |
| Total |
100.0% |
100.0% |
100.0% |
100.0% |
100.0% |
100.0% |
100.0% |
100.0% |
100.0% |
Fuente: Bureau of Transportation Statistics.